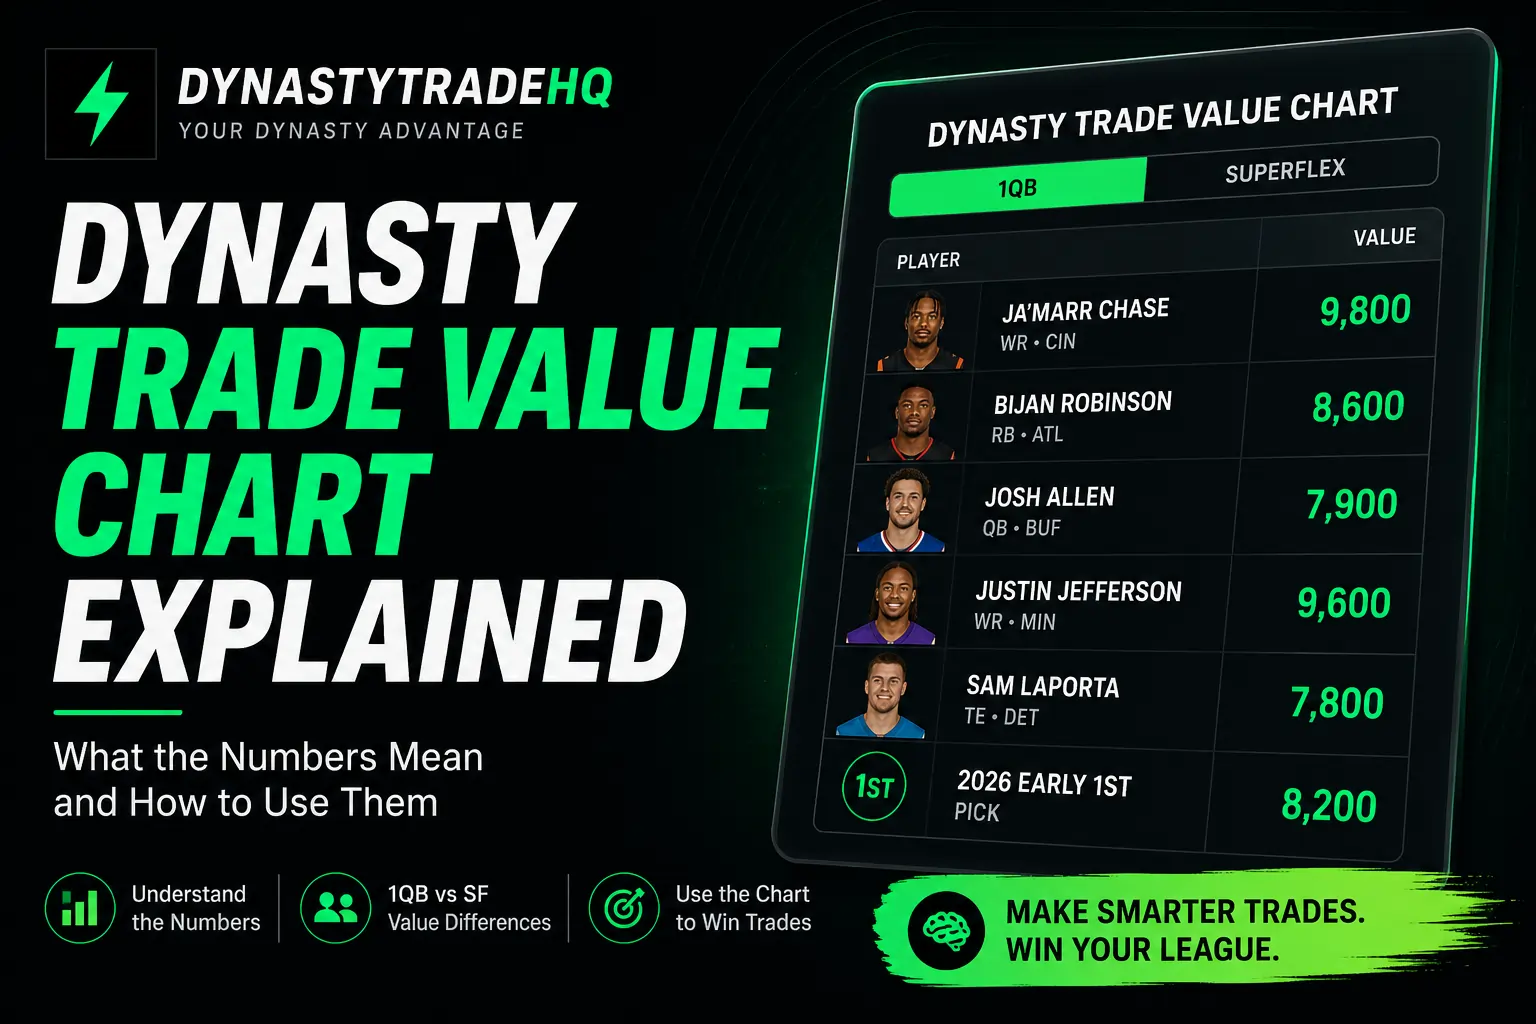
Most dynasty managers glance at a trade value chart right before sending an offer, check whether the numbers are close enough, and hit submit. That approach leaves real value on the table. A dynasty trade value chart is a standardized scoring system that assigns every player and pick a single number representing their worth relative to everyone else in your league format. Read this post, and you will know exactly what those numbers mean, why your 1QB values look nothing like your superflex values, and how to use the chart at the right moment in your trade process. Before you make your next offer, run the numbers on this trade.
Table of Contents
How a Dynasty Trade Value Chart Actually Works
A dynasty trade value chart assigns each player a point score based on their expected fantasy output over time, not just this season. The number is relative: the top player on the chart anchors the scale, and every other player is scored as a fraction of that ceiling. If Ja’Marr Chase sits at 10,000 and Bijan Robinson sits at 8,500, Robinson is worth roughly 85 percent of Chase, not 85 percent of some fixed dollar amount.
The number accounts for three things at once: current production, future production, and age trajectory. A 22-year-old wide receiver who is already a WR1 scores higher than a 28-year-old with identical current numbers because the younger player has more earning seasons ahead. A veteran running back with two elite seasons left may score lower than his current box score suggests.
The most important thing to understand is that dynasty trade value is not the same as redraft value. A dynasty trade value chart is a long-term asset pricing model, not a rest-of-season ranking. A player coming off an injury but under 24 years old may still hold most of his value because the chart is pricing the next four years, not the next four games. See how each player on your roster is priced right now on the dynasty player values page.
One more point that trips up newer managers: chart values represent what the market will accept, not what you personally believe a player is worth. If your chart says a trade is even and your gut says you are winning, the chart is telling you the floor. That gap between gut and chart is exactly where deals get made.
Why 1QB and Superflex Values Are Different Numbers
The format of your league fundamentally changes player values. A dynasty trade value chart built for a 1QB league treats quarterbacks as a relatively abundant position. There are 32 starters in the NFL and only one starter slot per team in most 1QB formats, so even elite quarterbacks carry moderate dynasty value compared to elite wide receivers.
Superflex changes the math completely. In a superflex league, a second quarterback slot means teams need two high-value QBs to be competitive. The supply of elite quarterbacks does not grow, but the demand doubles. That scarcity premium pushes the top quarterbacks into a tier that rivals or exceeds wide receivers at the top of the chart. What this means in practice: Josh Allen and Lamar Jackson sit near the very top of most superflex dynasty trade value charts. In a 1QB format, both players still have significant value, but they sit several spots lower than skill-position players like Ja’Marr Chase, Jaxon Smith-Njigba, and Bijan Robinson.
Before you look at anyone else’s trade offer analysis, confirm whether the numbers they quote are for 1QB or superflex. Using the wrong format’s chart to evaluate a trade in your league is the single most common valuation mistake in dynasty. The DynastyTradeHQ player values tool lets you toggle between formats so you are always comparing apples to apples. The 1QB/SF split also affects rookie draft picks. A 2027 first-round pick is worth more in superflex because it is more likely to land on a quarterback, who carries higher value in that format. Keep that in mind when picks are part of a trade package.
Reading the Numbers: What High, Mid, and Low Values Actually Tell You
Trade value numbers fall into tiers, and knowing those tiers is more useful than reading exact point totals. On most dynasty trade value charts, including the one on our dynasty player values page, the top 15 players cluster into what most managers call the elite tier. These are players you should not trade without receiving multiple assets in return.
The mid-tier, roughly players ranked 16 through 50, is where most trades actually happen. Players in this range are starter-quality, often have a clear ceiling, and are close enough in value that you can construct even or near-even trades using combinations from this group.
Below rank 50, values drop off sharply in most formats. This does not mean the players are worthless. It means a single mid-tier player usually outweighs two or three low-tier players in a trade, even when the raw point totals look close. A player valued at 4,000 points is worth more than two players each valued at 2,000 points because roster spots have a cost, and concentration of value wins championships.
There is also a difference between a player whose value has dropped and a player who was never highly valued. A veteran receiver at 2,500 points who was at 6,500 points two years ago is a sell: the market is pricing a decline. A 21-year-old receiver sitting at 2,500 points after a slow debut season may be a buy if the underlying situation has not changed. The chart number is the starting point. The question you ask next is: why is it there?
The Top 10 Dynasty Players by Value Right Now
The rankings below represent the current consensus 1QB dynasty value as of July 2026. These are not redraft rankings. Values are based on a long-term dynasty outlook that combines age, role, and production.
Rank | Player | Position | Team
1 | Ja’Marr Chase | WR | Cincinnati Bengals
2 | Puka Nacua | WR | Los Angeles Rams
3 | Justin Jefferson | WR | Minnesota Vikings
4 | Bijan Robinson | RB | Atlanta Falcons
5 | Malik Nabers | WR | New York Giants
6 | Jahmyr Gibbs | RB | Detroit Lions
7 | CeeDee Lamb | WR | Dallas Cowboys
8 | Brock Bowers | TE | Las Vegas Raiders
9 | Amon-Ra St. Brown | WR | Detroit Lions
Two things stand out from this list. First, wide receivers dominate: seven of the top 10 are WRs, reflecting the position’s combination of volume, longevity, and an age-curve advantage over running backs. Second, the two running backs who do crack the top 10, Bijan Robinson and Jahmyr Gibbs, are both under 25 and operating as true lead backs with receiving roles. Age and role security are what separate elite dynasty RBs from everyone else at the position.
Brock Bowers is the only tight end in the top 10, which is typical for dynasty formats. Tight end value concentrates at the very top and falls off sharply below that. Owning a TE1 like Bowers is a meaningful roster advantage because there is no adequate replacement available on the wire.
For the full list beyond the top 10, visit the dynasty rankings page.
How to Use the Chart Before Making a Trade Offer
The chart is a tool for framing offers, not for closing them. Use it in a specific sequence, and it will save you from both overpaying and underbidding.
Step one: Open the chart before you decide what to offer. Most managers do this backward: they pick the trade they want to make and then check if the chart supports it. Start with the chart instead. Pull up the player values page, find every player involved on both sides, and write down the totals.
Step two: look at the gap, not just the total. A trade that comes out exactly even on the chart is not necessarily a good trade. Ask yourself which side of the even trade you would rather hold for the next three years. If the answer is not in your favor, the trade is not actually even for your situation.
Step three: Use the chart to anchor your opening offer. If a player you want is valued at 7,000 points and your best offer is 5,500, do not send that offer and call it a negotiation. The chart tells you the market expects something closer. Build the package to the number first, then look at whether you have the assets to get there.
Step four: account for positional need. Dynasty trade value charts are format-adjusted but not roster-adjusted. A player with a value of 4,500 is worth more to a team with a hole at that position than to a team that is already stacked there. Use the chart to set the floor of a fair trade, then use your roster context to decide whether the deal is worth doing.
Superflex Rankings: Why Your Chart Needs a Format Tab
If your league runs superflex, you need a separate tab for your valuations. This is not optional. Using 1QB values to evaluate a superflex trade will lead you to systematically underprice quarterbacks and overpay for skill positions every time.
The DynastyTradeHQ superflex rankings break out values specifically for two-QB formats. The practical difference is significant. A quarterback like Josh Allen or Drake Maye sits in a different tier entirely in Superflex than they do in 1QB. In Superflex, owning two top-12 quarterbacks is a competitive advantage, the way owning two top-5 wide receivers is in any format.
The secondary effect of Superflex on the dynasty trade value chart is how it affects late rookie picks. A late first-round pick in Superflex carries a meaningful chance of becoming an elite quarterback, which makes those picks trade for more than the same pick in a 1QB league. When you are evaluating a trade that involves future draft capital in superflex, you need superflex-specific pick values, not a blended chart.
One practical tip: if you are ever discussing a trade with a manager who plays in a different format than you, you will quote values that mean completely different things. Before negotiating across league formats, confirm which format the chart you are both looking at is built for.
Is the Dynasty Trade Value Chart Worth Trusting?
The chart is worth trusting as a reference point. It is not worth treating as a verdict. A dynasty trade value chart reflects the current market consensus across thousands of managers. That makes it accurate at the aggregate level and occasionally wrong at the individual level.
Where the chart tends to be most accurate: elite players with stable situations, rookie picks in the near term, and veteran players in the middle of their careers. These are the players for whom the market has the most information, and whose values have been stress-tested by real transactions.
Where the chart can lag: recently injured players, players who have just changed teams, and rookies in their first 6 weeks in a new situation. The market adjusts, but not instantly. If you track news closely, you will often spot a player whose real-world situation has shifted before the chart catches up. That gap is where buy-low opportunities live.
The best way to use any dynasty trade value chart, including the one at DynastyTradeHQ, is as your starting point for every conversation. When someone sends you an offer, check the chart. Before you send an offer, check the chart. When a trade is agreed, and you feel good about it, check the chart one more time to confirm you did not miss something obvious.
Is the Dynasty Trade Value Chart Worth Checking Before Every Trade?
Yes, every time. Most lopsided trades happen when one manager has checked the dynasty trade value chart and the other has not. Even five minutes with the chart before sending an offer can prevent the most common mistake in dynasty: trading on feel rather than market value.
Before you send that offer, see exactly how your trade stacks up in your format.
Run Your Trade Through the Calculator
FAQs
What is the dynasty trade value?
Dynasty trade value is a numerical score assigned to each player and pick that represents their worth relative to other assets in your league format. The number accounts for both current production and long-term outlook based on age and role. Higher numbers mean the asset is worth more in a trade negotiation.
How do I read a dynasty trade value chart?
Find each player involved in the trade and add up the point totals for both sides. The side with the higher total is getting more value. The chart uses relative scores, so the top player anchors the scale, and every other player is a fraction of that number. Gaps of 10 to 15 percent or more usually indicate an uneven deal.
Why are dynasty player values different in superflex leagues?
In superflex leagues, teams start two quarterbacks, which creates scarcity at the position and significantly drives up quarterback values. A quarterback like Josh Allen or Drake Maye is worth far more in superflex than in a standard 1QB format. Always use a format-specific chart when evaluating trades in your league.
How often does the dynasty trade value chart update?
Dynasty trade values should update at a minimum after major news events: injuries, trades, free agency moves, and NFL Draft picks landing with new teams. A chart that hasn’t been updated in several weeks may not accurately reflect current player situations, which is why checking a live tool before each trade offer matters.
